作者:黄天元,复旦大学博士在读,热爱数据科学与开源工具(R),致力于利用数据科学迅速积累行业经验优势和科学知识发现,涉猎内容包括但不限于信息计量、机器学习、数据可视化、应用统计建模、知识图谱等,著有《R语言数据高效处理指南》(《R语言数据高效处理指南》(黄天元)【摘要 书评 试读】- 京东图书,《R语言数据高效处理指南》(黄天元)【简介_书评_在线阅读】 - 当当图书)。知乎专栏:R语言数据挖掘。邮箱:huang.tian-yuan@qq.com.欢迎合作交流。
近接触了TidyFriday这个国内的R语言先进组织,发现上面有很多的地理可视化资源,这里放上链接:
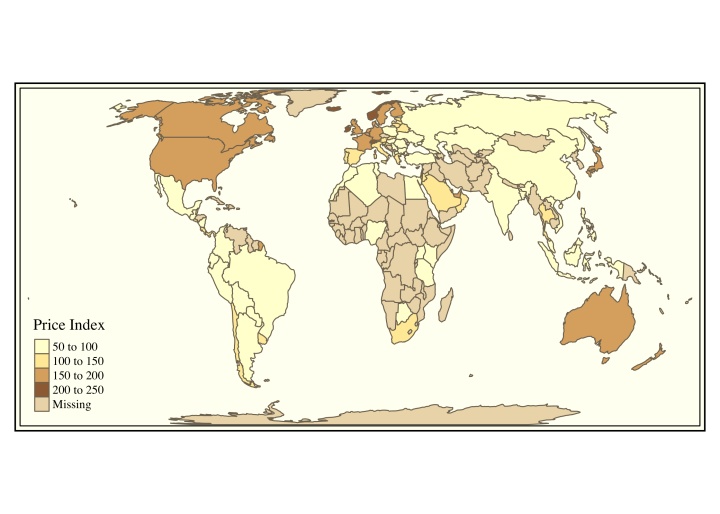
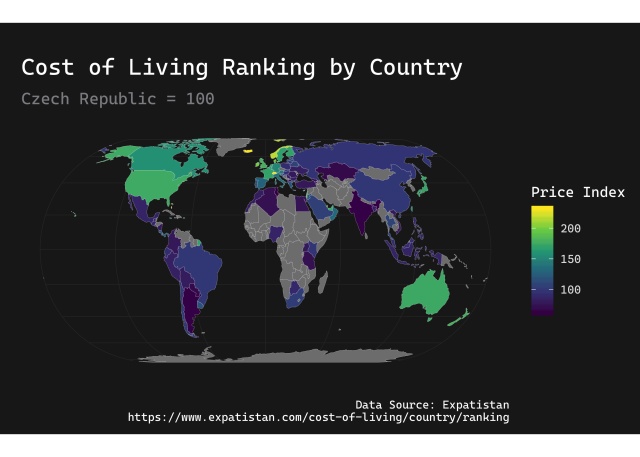
https://czxa.top/tf/expatistan.html
https://czxa.top/tf/ggplot2+sf.html
https://czxa.top/tf/ggplot2+sf+discrete.html
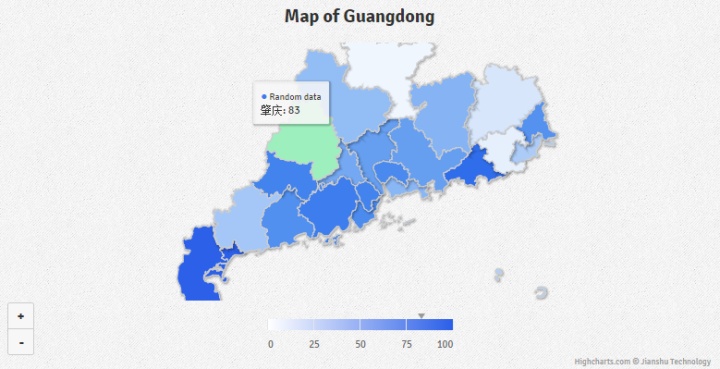
https://czxa.top/tf/hchinamap.html
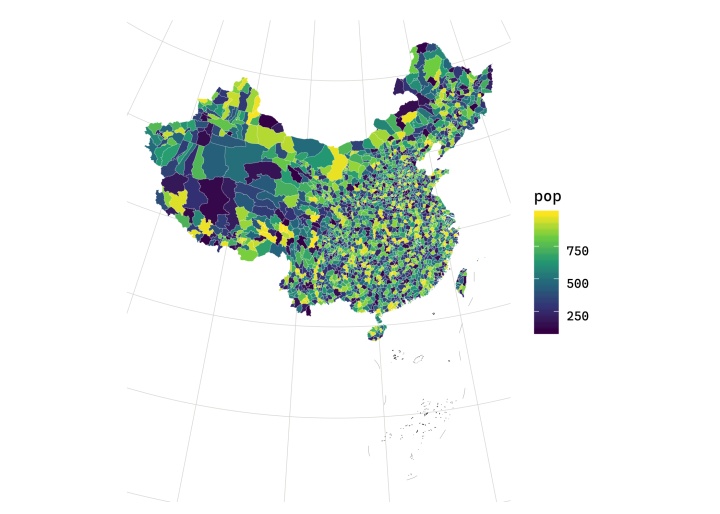
批量绘制GIS图,不要太好看:


网站维护者还做了一个包,叫做hchinamap,只要我们自己为各个省份赋值,就能够定制化输出交互GIS图(见https://czxa.top/tf/hchinamap.html):

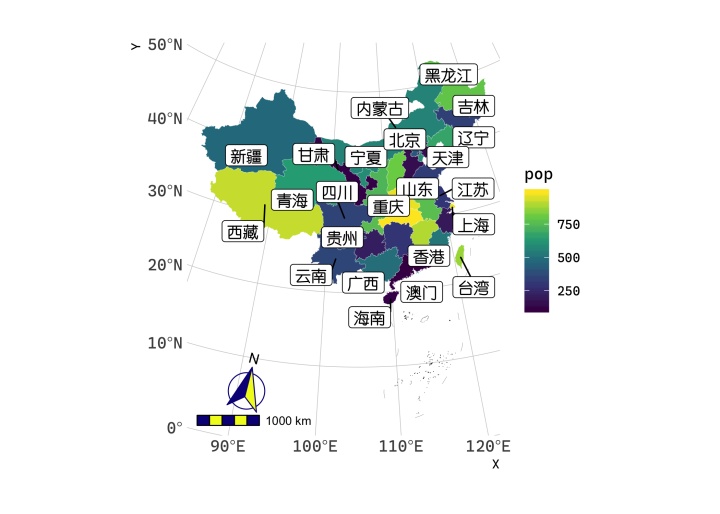
指北针、比例尺、名称标签,一应俱全:

只要有.shp格式的文件,就能够细分到街道、河道:


这里就不直接拷贝代码了,大家直接去原文去找:
https://czxa.top/tf/expatistan.html
https://czxa.top/tf/ggplot2+sf.html
https://czxa.top/tf/ggplot2+sf+discrete.html
https://czxa.top/tf/hchinamap.html
近还加入了作者的微信群,日常会分享很多相关内容,在此进行分享:

在中国本土能够加入先进R语言交流团体,非常高兴。希望R社区更加繁荣!