用于简化任务,辅助机器学习算法建模的python工具包每时每刻都在出现,但并非每一个工具都能在你的机器学习工作流中占有一席之地。
一个月前笔者发现了一个名为Yellowbrick的库,使用之后立马决定将它收入了自己的机器学习工作包。这篇文章就带你走进Yellowbrick,它能增进使用者对模型的理解,简化模型选择过程,真·入股不亏!

简介
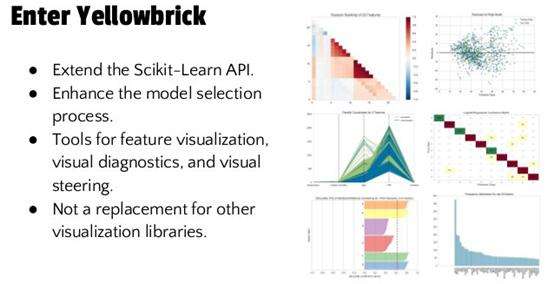
Yellowbrick是一个开源的python项目,其中包含了scikit-learn 和 matplotlib用于创建可打印的图片和交互性的数据挖掘结果。它实际上是一个用于机器学习的可视化诊断平台,通过评价表现、稳定性和预测价值来帮助用户操控模型选择过程,并且进一步帮助分析工作流中的问题。
它得名于1900年的小说《绿野仙踪》。书中的主人公必须沿着一条黄色的石砖路抵达目的地翡翠城。
安装
简单的安装方式就是使用PyPI中的 pip指令,这是Python推荐的安装方式。
$ pip install yellowbrick要将Yellowbrick更新到新版本,请使用如下命令:
$ pip install -U yellowbrick

使用Yellowbrick
Yellowbrick中重要的接口叫做可视化器——一个学习数据以产生可视化结果的对象。它是scikit-learn 库中的Estimator对象,拥有类似的接口以及绘图工具。要使用可视化器,只需执行和使用scikit-learn时一样的工作流程。导入可视化器,创建一个实例,调用fit方法,然后调用show方法进行渲染。
一些常用的可视化器有:
· 特征分析可视化器
· 回归可视化器
· 分类可视化器
· 聚类可视化器
· 模型选择可视化器
· 目标可视化器
· 文本可视化器
接下来将逐一编写和执行这些可视化器。

1. 特征分析可视化器
特征分析可视化器用于寻找可能影响后续拟合的特征或目标。这里运用多种标准,分别对单项特征和特征对进行[-1, 1]和[0, 1]范围内的评价打分。
使用只考虑一项特征的评分算法对一维特征评分
from yellowbrick.dataets import load_credit
from yellowbrick.features import Rank1D

# Load the credit dataset
X, y = load_credit()

# Instantiate the 1D visualizer with the Sharpiro ranking algorithm
visualizer = Rank1D(algorithm='shapiro')

visualizer.fit(X, y)           # Fitthe data to the 可视化器
visualizer.transform(X)        #Transform the data
visualizer.show()              #Finalize and render the figure# Note: I have used the yellowbrick'spre-loaded datasets to implement all the 可视化器s.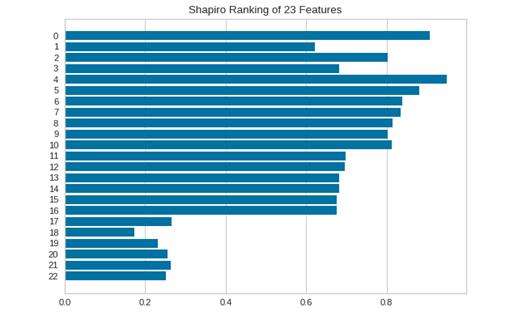

使用考虑一对特征的评价算法对二维特征进行评分:
from yellowbrick.datasets import load_credit
from yellowbrick.features import Rank2D
# Load the credit dataset
X, y = load_credit()

# Instantiate the visualizer with the Pearson ranking algorithm
visualizer = Rank2D(algorithm='pearson')

visualizer.fit(X, y)           # Fitthe data to the visualizer
visualizer.transform(X)        #Transform the data
visualizer.show()              #Finalize and render the figure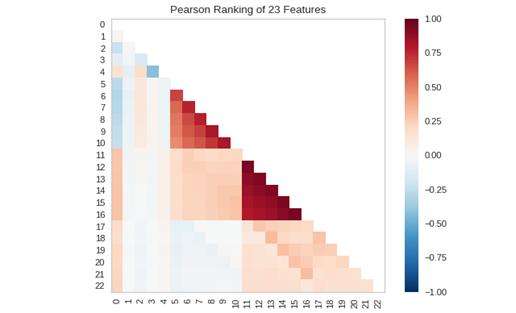

2. 回归可视化器
回归模型用于预测连续空间内的目标。回归分数可视化器在模型空间中展示实例以帮助用户更好地理解模型预测的方式。这里将介绍预测误差散点图,它刻画了模型空间中的预期值和实际值。
from sklearn.model_selection importtrain_test_split
from sklearn.linear_model import Lasso
from yellowbrick.datasets import load_concrete
from yellowbrick.regressor import PredictionError

# Load a regression dataset
X, y = load_concrete()

# Create the train and test data
X_train, X_test, y_train, y_test = train_test_split(X, y, test_size=0.2,random_state=42)

# Instantiate the linear model and visualizer
model = Lasso()
visualizer = PredictionError(model)

visualizer.fit(X_train, y_train)         #Fit the training data
visualizer.score(X_test, y_test)         #Evaluate the model
visualizer.show()                        #Render the figure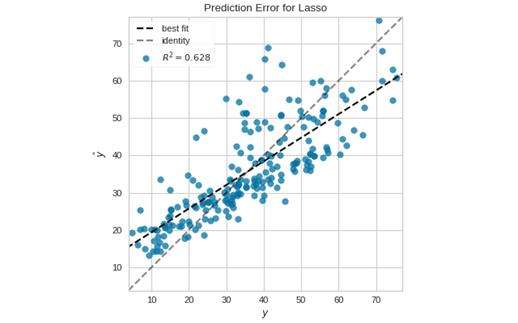

3. 分类可视化器
分类模型用于预测离散空间中的目标,这一离散空间包含一种或多种独立变量的实例。分类评分可视化器展示不同类间的区别以及一些针对分类模型的可视化评估。
下面是混淆矩阵可视化器以及它的快速方法confusion_matrix,该方法使用相关变量创建一个ConfusionMatrix对象,并对其拟合和渲染。
from yellowbrick.datasets import load_credit
from yellowbrick.classifier import confusion_matrix
from sklearn.linear_model import LogisticRegression
from sklearn.model_selection import train_test_split as tts

#Load the classification dataset
X, y = load_credit()

#Create the train and test data
X_train, X_test, y_train, y_test = tts(X, y, test_size=0.2)

# Instantiate the visualizer with the classification model
confusion_matrix(
    LogisticRegression(),
    X_train, y_train, X_test, y_test,
    classes=['not_defaulted','defaulted']
)
plt.tight_layout()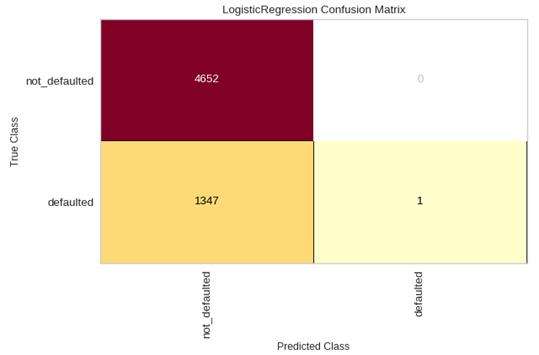

4. 聚类可视化器
聚类模型是用于在未标记的数据中挖掘模式的无监督方法。Yellowbrick库提供了能够可视化和评价聚类表现的yellowbrick.cluster模块。
Kelbow可视化器使用一个范围内的k值来拟合模型,从而选择优个数的聚类。如果折线图形如手臂,那么“手肘”(曲线的转折点)就很好地指示了该点合适的潜在模型。在这个可视化器中,“手肘”将被着重标注。
from sklearn.cluster import KMeans
from sklearn.datasets import make_blobs

from yellowbrick.cluster import KELbowVisualizer

# Generate synthetic dataset with 8 random clusters
X, y = make_blobs(n_samples=1000, n_features=12, centers=8, random_state=42)

# Instantiate the clustering model and visualizer
model = KMeans()
visualizer = KElbowVisualizer(model, k=(4,12))

visualizer.fit(X)        # Fit thedata to the visualizer
visualizer.show()        # Finalizeand render the figure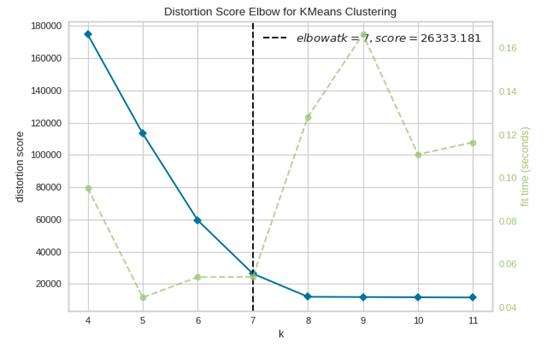

5. 模型选择可视化器
yellowbrick.model_selection程序包提供了能够观察交叉验证和超参数调整性能的可视化工具。很多可视化器包含了yellowbrick.model_selection中的功能,其他可视化器在这些功能的基础上搭建多模型的比较工具。
模型验证能够判断一个预测因素在用它进行预测的数据集中的可靠程度,以及结果在新输入中的可推广性。
要衡量一个模型的性能,首先将数据集划分为训练集和测试集,用模型拟合训练数据并使用测试集评估模型。选择模型的超参数使得模型在特定特征空间的性能达到优。
本例将通过对一个回归数据集应用ValidationCurve 可视化器来探索它的使用。
import numpy as np

from yellowbrick.datasets import load_energy
from yellowbrick.model_selection import ValidationCurve

from sklearn.tree import DecisionTreeRegressor

# Load a regression dataset
X, y = load_energy()

viz = ValidationCurve(
    DecisionTreeRegressor(),param_name="max_depth",
    param_range=np.arange(1, 11), cv=10,scoring="r2"
)

# Fit and show the visualizer
viz.fit(X, y)
viz.show()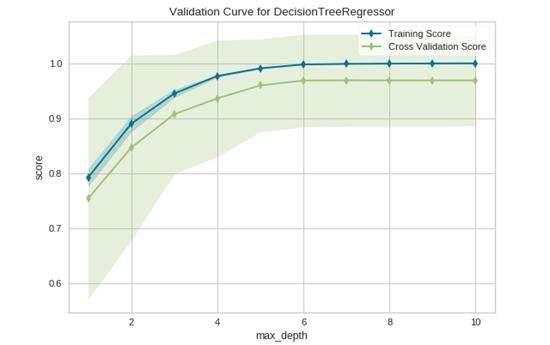

6.目标可视化器
这类可视化器专门用于刻画有监督学习中的独立变量,这类变量经常被称作y或者目标(the target)。这里将介绍类平衡可视化器。
训练数据中的类不平衡是训练分类模型时遇到的大问题之一。在解决这一问题之前,了解训练数据中的类平衡概念非常重要。类平衡可视化器通过创建代表数据在数据集中出现频率的条形图来实现它的目的。
from yellowbrick.datasets import load_game
from yellowbrick.target import ClassBalance

# Load the classification dataset
X, y = load_game()

# Instantiate the visualizer
visualizer = ClassBalance(labels=["draw", "loss","win"])

visualizer.fit(y)        # Fit thedata to the visualizer
visualizer.show()        # Finalizeand render the figure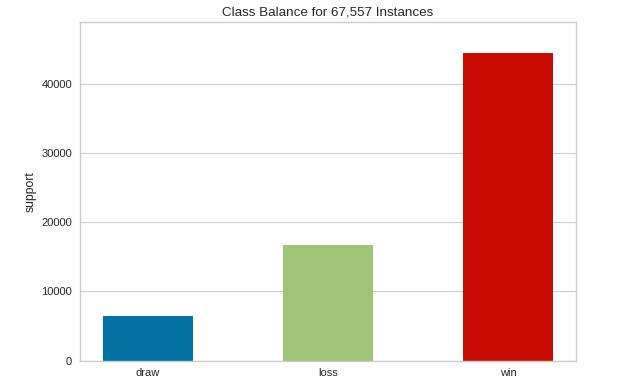

7. 文本建模可视化器
后一个可视化器包含在yellowbrick.text模块中,它被专门设计用于处理文本。
Text可视化器类专门处理并非数值型数组或数据框架的语料库。它提供了许多功能用于分析词语分布,刻画文本相似性,并且包含一些其他标准的文本分析可视化工具。这里将介绍用于形符频率分布的频率可视化工具:
from yellowbrick.datasets import load_game
from yellowbrick.target import ClassBalance

# Load the classification dataset
X, y = load_game()

# Instantiate the visualizer
visualizer = ClassBalance(labels=["draw", "loss","win"])

visualizer.fit(y)        # Fit thedata to the visualizer
visualizer.show()        # Finalizeand render the figure
上述内容涵盖了Yellowbrick库中一些常用且有用的可视化工具。但这并不是全部,Yellowbrick还包含了RadViz, PCA projection, Feature Correlation, Residual Plot, Cross-Validationscore等等可视化工具,这些工具同样十分有用且便捷。
去试试吧,相信你的工作包也会为它留下一席之地。

来源 https://zhuanlan.zhihu.com/p/142869104
