这里的调优可以泛指任何随着外部环境变化(比如workload、系统资源、bottleneck的出现)而改变的操作,比如change parallelism、optimize execution plan、live migration等等 [dspa20-12 dspa20-13 dspa20-14]。下面用几个例子来介绍下。
1. Reconfiguration
有时候我们需要change parallelism。比如观测到Dataflow Graph中的某个operator出现了bottleneck,就需要给它加几个节点,提高它的parallelism(反之也可以降低parallelism来节省资源)。基本思路是:1).对当前系统保存savepoints(user-triggered checkpoint, save application’s state) 2).关闭application,然后在新的parallel nodes上重新启动。
对于stateful operator,还需要对原来的state进行redistribution或者replicate,重新分配到新的节点上。因为state本质上是一些key-value pairs,一致性哈希就可以满足基本要求。
2. Automatic scaling control
这个其实是接着上面的话题来谈的。前面提到了如何scaling,这里关注的是如何自动确定scaling的策略。包括:1).detect metrics 2).policy 3).action。[dspa20-13]中列出了几种传统的策略(Queuing theory/Control theory/Heuristic),但它们都不太好用。这里用几篇近的paper举例说明一下近的进展(只简要说明idea,详细内容可以参考原文)。
1). [NSDI’18]
为了降低整个dataflow graph的运行时间,如果我们能发现graph中的critical path(关键路径),就可以发现影响整个graph完成时间的因素,进而优化它们。但是和其他系统不同,streaming job是无穷尽的,因此还需要find critical path online。本文关注的就是这个问题。
首先我们可以借助的windowing,do periodic snapshot and cut the stream into fixed size windows. Analyze each window and get performance summary for each window.
但对于streaming job,我们无法得知完整的graph,每个window中选出来的(一个)critical path可能并不在全局的critical path上。因此我们可以对每个window都选出多个critical path,并且predict the critical path in the future。这里的思路是the more critical paths an activity appears on, the more probable this activity is critical(it could be on a potential critical path)。之后作者定义了一个critical participation metric来衡量它。
在一些graph processing system做的evaluation显示,Driver(coordinator)更经常出现在critical path上。
2). [OSDI’18]
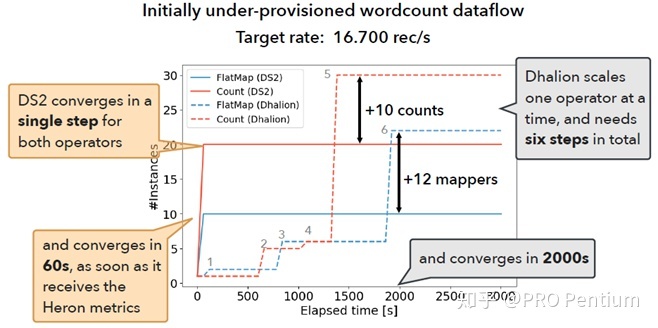
本文关注的问题是在一个dataflow graph上,如何自动发现已成为bottleneck的operator、并且自动scale。本文希望让自动调优到target throughput的过程所需reconfiguration步数更少,调优效果更准确。其中Bottleneck的定义是该operator处理太慢了,影响downstream的速率[Figure 2]。
针对如何自动detect bottleneck的问题,使用[NSDI’18]中实现的profiling tool。Use dataflow graph to extract operator dependencies and system instrumentation to collect accurate, representative metrics。

通过上述工具,我们得到了每个operator在没有bottleneck的理想情况下的capacity(指标是throughput)。之后用linear prediction model来拟合出parallelism和throughput之间的关系。为了避免预测值(parallelism)出现上下摇摆震荡,我们预测出upper bound和lower bound,而不是直接预测值[Figure 4]。这样可以保证预测值只向一个方向scale up/down(不然reconfiguration的开销会很大)。每次reconfiguration一轮之后重新监测指标,然后recompute model to minimize error,直到后得到target throughput。在Flink上的Evaluation显示它可以明显减少调优到target rate所需的reconfiguration次数,收敛更快,而且终性能也更接近target[Figure 6]。
个人感觉这篇paper非常有SIGMOD17 OtterTune的影子…可能因为问题比较相似吧
3. State migration
前面提到过对于stateful operator,在reconfiguration时节点数量可能会有变动,就需要在不同节点之间对state(key-value pairs)进行migrate。在一个线上运行的streaming system中玩这种操作无异于空中加油。一种比较粗暴的策略是pause-and-restart,意思是先用一个buffer接住来自upstream的数据,然后把当前operator直接停机并且snapshot + migrate,完成后再开闸放水。这会导致migrate期间很多operator被阻塞。
[VLDB’19]提出了一种live state migration,意思是把state migration也看作一种dataflow operation,然后让细粒度的fine-grained state transfer和processing交替运行。
为了实现这个目的,本文引入了timely dataflow的概念。timely dataflow的本意是通过为operator引入时间戳(logical timestamp)的概念,使得streaming system可以计算带有环的dataflow graph(很多需要增量更新/迭代计算的任务都需要)。timely dataflow是由多个worker并行处理的,每个worker都有整个dataflow的一个副本(每个可以用来计算不同timestamp的dataflow),它们之间可以通过message进行通信。定义Frontier表示之后只能接收timestamp大于等于frontier的message(类似watermark的含义),那么frontier也就是timestamp早的一个标记(frontier可以理解为待处理的event中早的一个,或者说这些待处理event组成的graph中入度为0的点。在[SOSP’13]的2.3节有更详细的介绍)。[ch3.1]
在state migration的问题中,本质也是对不同worker上的key-value做更新操作。我们也可以对这个更新操作(operator)定义timestamp,表示某一时间之后的dataflow才进行更新。通过这样设计,我们就可以把单一的、工作量巨大的state migration task(需要停机很长一阵完成)拆分成若干个小的update operator(可以在不同时间完成,这样中间就可以穿插别的工作,避免长时间停机)。[ch3.3]
[Fig3]对需要live state migration的operator进行了重新设计。L是原来实现operator和储存state的部件,另外新加的部件有F(接收dataflow和migration的input,分别输出data和migrate出来的state)和S(接收F的输出,然后apply到L上)。其中F用来确定何时执行流过来的migration操作(通过将timestamp与frontier进行对比),如果暂时不能migrate就可以先buffer起来。这样来保证only complete state is migrated。[ch3.4]
这篇好难啊…反复看了好多遍才明白了个大致意思…如有错误欢迎指正
4. Flow control and load shedding
其实这和调优关系不大了…不过还是放在这一节里吧。[dspa20-14]
前面提到过streaming system可以看作一个生产者-消费者模型。有时候生产者产生事件的速度会非常快,超出了消费者(streaming system)处理速度。全都先buffer起来肯定是不现实的。比较常用的应对策略有以下几种:

1). Load shedding
它会选择性的drop一些record。属于牺牲一些准确度来保证latency,类似于在低网络带宽下降低video streaming的画质来保证不卡顿。
Load shedding可以被做成drop operator丢到dataflow graph的指定位置中,它需要根据得到的stat information来确定如何drop(比如drop window/tuple,要drop多少等等),本质是一个optimization问题。
2). Back-pressure
意思是把upstream到来的超出处理能力的record先缓存起来(需要一个persistent queue,例如kafka),保证downstream的rate不超过某个阈值。位于downstream的back-pressure的限流效果会一直propagate到upstream,直到data stream source。
3). Elasticity
前面提到的动态调优就属于这种,可以根据workload变动情况自动分配资源。
为了加深理解,后来看facebook在ICDE’20上刚刚发表的一篇paper:Turbine: Facebook’s service management platform for stream processing。工业界的很多system paper都是已经大规模上线运行多年后再整理发表的,含金量很高。
Turbine是针对streaming system设计的集群管理系统。传统的集群管理系统比较适用于resource requirement can be determined in advance的场景,但streaming workload是多变的,又需要很强的实时性(low latency),传统系统很难满足这个要求。而在stream processing system中,any feature that involves manual effort to scale eventually becomes an operational bottleneck。因此Turbine实现了以下几个特性:1).Automatically adjusting resource allocation 2).fast task scheduling and failure recovery 3).ACIDF(F表示fault tolerance) application update mechanism。下面我们就分别看看如何实现这些特性。
Turbine包括以下三个组件:job management(store job configurations and manage job updates, decide what to run),task management(convert job into tasks and schedule tasks across clusters, decide where to run),resource management(automatically adjust resource allocation in real time, decide how to run)。具体结构可以看这张图:

在Turbine中,一个job可以包含多个task,这些task在各自部分的数据上(a disjoint subset of the input data)并行运行相同的binary(job)。不同task之间尽量不存在依赖关系。
1. Job Management
Job代表被compile之后的streaming application。暂时跳过这一段hhhh
2. Task management
这部分的目的是把task分发到各自的worker上运行,需要保证无duplicate workers running same task、失败之后migrate并重启、load balance等。
Job被送到一个集中的task service组件。它会实时从Job Store获取job,生成task,并存入Task Specs(include all configurations necessary to run a task, such as package version, arguments, number of threads)。每个Turbine Container都有一个本地的task manager,它们定期拉取task specs的镜像(包含了所有的task),从中选出本地容器内可以运行的stream processing task。

Scheduling:为了实现负载均衡,待处理的数据会被拆成多个shard(分片),存放到不同container上。Local Task Manager会负责不同shard和task之间的匹配。
Load balancing:在运行过程中,系统会实时维护每个container的capacity、每个shard的load(性能开销),并通过scheduling algorithm实现二者的佳匹配。
Failure Handling:和大多数系统一样,Turbine也是用heartbeat来检测failed node。
3. Resource Management
这也是篇幅长的部分了。Auto Scaler的目的是:1).动态调节container上的资源,保证jobs的运行 2).同时尽量降低这一过程中migrate的代价(比如尽量少restart task)。而Auto Scaler的开发也经过了好几个版本的不断改进。
A:代reactive auto scaler:见Algorithm2,大体意思就是根据运行速度、是否OOM(out of memory)等来判断job所在的worker是不是该扩容/缩容了。但这里有一些问题:1).job的资源占用一开始波动会很剧烈 2).我们无法提前知道每个job低需要的资源量,万一downscaling错了风险会很大 3).有时候不知道问题的根源,盲目进行scaling也不大好(作者举了一个例子,比如一个job总是connection failure导致速度慢,此时还给他增加parallelism趋势会导致更多的failure和connection traffic)。另外,作者观察到the amount of resources needed for a given job is often predictable。那还说啥,all in ai就是了!
B:第二代proactive(积极的) auto scaler:加入了两个组件:1).Resource Estimator(estimate the usage of a given resource)。它对stateful / stateless两种类型的job所需的资源(CPU+memory+disk / 主要是CPU)进行了分析。对于CPU资源(也是stateless主要的资源消耗),可以动态估计出maximum stable processing rate a single thread task can handle,然后作者认为cpu消耗是随着线程数增加而线性增长的【comment:真的吗……】。 2).Plan Generator(uses these estimates to construct a resource adjustment plan)。它根据步estimate出的结果来调节resource,并保证不会发生前面提到的代auto scaler中出现的(1),(2),(3)三个问题【comment:但并没有详细说明是如何解决的,特别是stateful情况下的存储消耗…也可能是我没看懂hhh】。
C:第三代preactive(主动的) auto scaler:其实这个是接着第二代来讲的。前面说了我们要all in ai,这一节就介绍了Pattern Analyzer这个组件(infer patterns based on data seen and to apply this knowledge for pruning out potentially destabilizing scaling decisions)。它会分析两种data:1).Resource Adjustment Data。这一段主要为了解决(2)downscaling错这个问题。它会记录下每次调整resource的动作供后面的策略参考。 2).Historical Workload Patterns。作者发现workload的pattern是非常有规律的,比如大家都喜欢白天刷facebook。利用这些数据我们可以尽可能减少需要resource adjustment的次数。作者提出的策略是记录下近14天的workload(比如input rate)数据集,每次做出调优策略后,先在数据集上模拟的verify一下,目的是it verifies that this reduction will not cause another round of updates in the next x hours。但也有时候historical data也是不太准的,这个就是future work了。【comment:个人感觉这里可以进一步ai化。目前的策略还是比较rule based的】
D:untriaged problems:这里说的是像(3)那种allocating more resources会导致情况恶化的问题。作者给出的方法非常简单明了:fires operator alerts that require manual investigation :)
E:vertical VS horizontal:这里说了两种scaling的策略:vertical(applies resource allocation changes within the task level without changing the number of tasks)和horizontal(changing the number of tasks to increase or decrease job parallelism,和前面OSDI’18那篇paper一样)。
F:capacity management:这一步目的是makes sure each resource type has sufficient allocation cluster-wide。
前面提到的所有组件加起来大概就形成了这么一套系统:

4. Evaluation
先略过了。。。
5. Conclusion and future work
Going forward, we plan to investigate machine learning techniques for automatic root cause analysis and mitigation of incidents that previously required human intervention.
一句话:all in!
参考资料
[DDIA]:DDIA英文版
[Streaming 101]
[Streaming 102]
[dspa20]